Dashboard
I like to see my memory and CPU loads throughout my work day just to see the cause of some hangups I exprience. Because of this, I like to have this information displayed in the top bar of my desktop.
Basically all of this information was taken from this link but I’m paraphrasing here for simplicity and in case the link is taken down.
The package that I use is called indicator-multiload.
Installation
$ sudo apt-get install indicator-multiload
Starting the Application
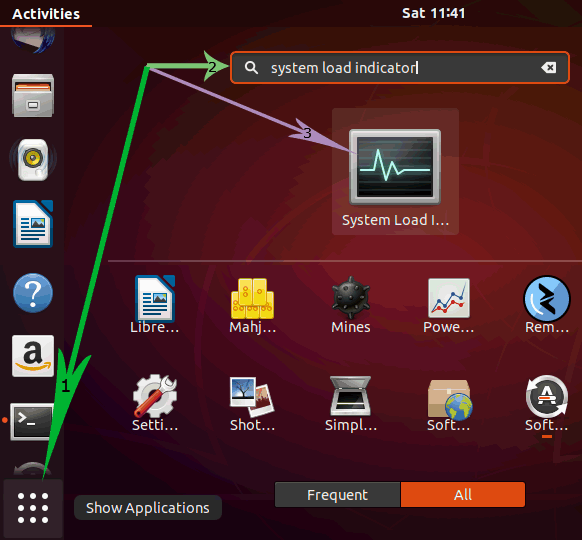
Start the application by typing “System Load Indicator” in the dash search box.

The application shows info in the graph format by default (which I do not like).

My Customization Options
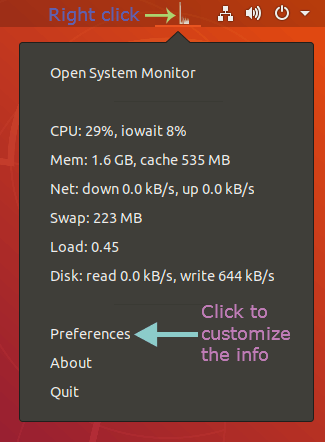
To customize the application, right click the graphical representation of the load in the top bar and click the Preferences menu.

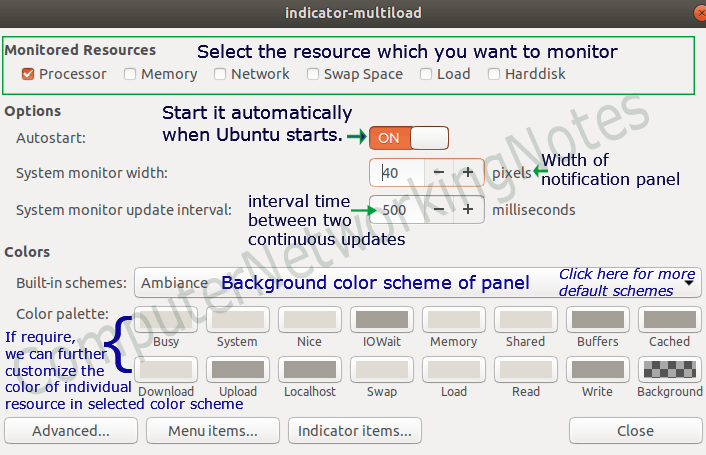
- Turn on autostart.

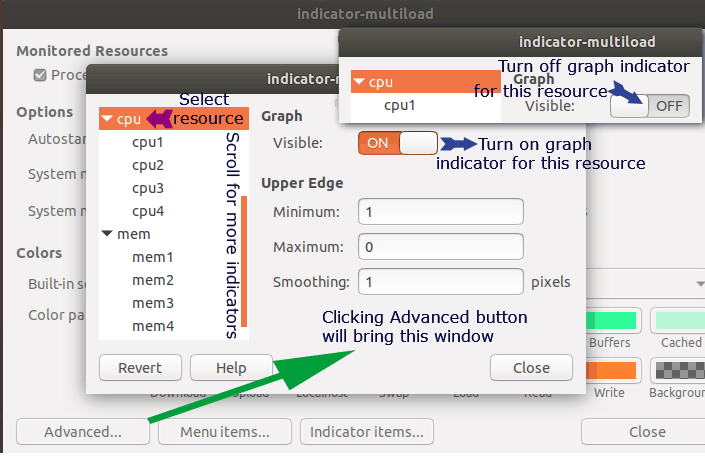
- Go to the advanced customization screen.
- Turn off the graphical representation for each resource.

- Turn off the graphical representation for each resource.
- From the main screen, go to the
Idicator items...screen. There will be a blank line at the top. Move one of the lines to the top and type in the following:CPU: $(percent(cpu.inuse)) Mem: $(size(mem.user))